BY: AMANDA SIA
What is Big Data & Predictive Analytics?
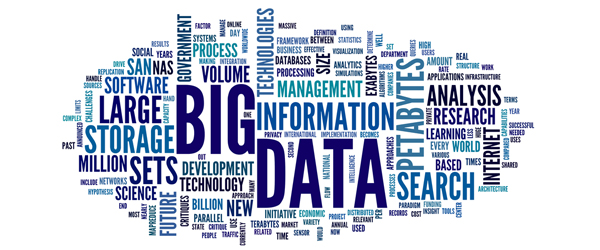
Image from http://amppob.com/big-data-how-companies-are-leveraging-our-consumer-footprint/
Despite being such a buzzword recently, big data is still a pretty nebulous term. While datasets have always existed, with recent advances in technology, we have more ways than ever to capture huge amounts of data (such as through embedded systems like sensors) and better ways to store them. Big data also encompasses the processes and tools used to analyze, visualize, and utilize this huge volume of data in order to harness it and help people make better decisions.
Predictive analytics is another word that is often seen with big data. In essence, predictive analytics refer to the use of historical data and statistical techniques such as machine learning to make predictions about the future. An example might be how Netflix knows what you want to watch (predictions) before you do, based on your past viewing habits (historical data). It is also important to note that data doesn’t such refer to rows and columns in a spreadsheet, but also more complex data files such as videos, images, sensor data and so forth.
Ok, I think I understand big data and the concept of predictive analytics, but how does it apply to food?
Image obtained from https://www.stacyssnacks.com/
The best way to see how big data applies to our food is through an example from my own life. It’s no secret that I love Stacy’s Pita Chips. Despite so, it was a surprise when I opened up my Kroger app the other day and found a digital coupon for these pita chips staring straight back at me. How did they know what I was thinking? Was it just a happy coincidence?
Kroger was actually one of the first food retailers in the US to jump onto big data analytics bandwagon, by using previously collected consumer data to generate personalized offers as well as tailored pricing for its consumers1. They were also the first to use infrared body-heat sensors combined with a computer algorithm to track how customers were moving through the store, and accordingly, predict how many cashiers to deploy, thus shortening check-out time for shoppers2.
Image from https://www.foodlogistics.com/sustainability/news/12037176/will-kroger-enter-florida
From first glance, it appears that data analytics employed in the food industry is often centered around supply chain management, operational efficiency and marketing1, such as mining consumer data to understand their behavior, or figuring out how to stock products at the right time to give companies a competitive edge. However, big data is also a major player in food quality and safety, but is not often talked about. This particular article focuses on four more case studies in which big data analytics are employed for advancing food safety.
Case 1: Yelp + Twitter = Frontiers in foodborne illness surveillance?

Image from https://en.wikipedia.org/wiki/Yelp and https://services.athlinks.com/big-run-media-twitter-tips-for-race-organizers/
Yelp is a crowd-sourced review website that allows users to submit reviews of local businesses, including restaurants. Columbia University’s Computer Science department developed a script that uses text classification to dig through Yelp reviews for keywords such as “sick” or “vomit”4. Epidemiologists and investigators may then try to interview some of the reviewers and find out what their symptoms were, what the incubation period was, and what else they might have eaten. The NYC Department of Health works with Columbia University to aggregate data from both Yelp and Twitter, and based on the locations and restaurant names mentioned, matches these complaints to specific restaurants. Establishments with multiple complaints are flagged and investigated by the Department of Health. Using this system, The NYC jurisdiction has identified 10 outbreaks and 8523 complaints of foodborne illnesses since the pilot program launched in 20126.
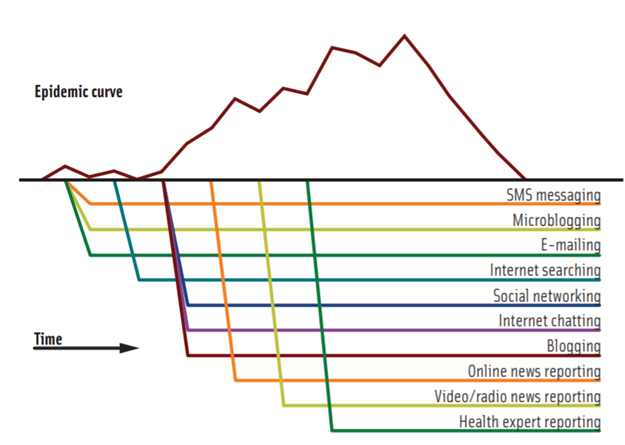
Image from https://www.researchgate.net/publication/295559053_Big_Data_in_Food_Safety_and_Quality
Given that foodborne illnesses are overwhelmingly underreported and underdiagnosed in the general population, the popularity of social media is a great tool to catch foodborne illnesses and outbreaks. Whether deliberately or not, consumers are already using social media to document their symptoms. The program’s success speaks for itself, with similar systems being tested out across the country. Consumers’ self-documentation on social media can also warn other consumers of potential foodborne risks before health agencies like FDA and CDC make an official announcement, and this timely information could prevent more people from getting sick. However, it also brings into the question of how reliable consumer reports and reviewers are and highlights the tradeoff between speed (receiving outbreak information from twitter) and accuracy (waiting to find out from your local health department or CDC).
Case 2: Geographical Information Systems (GIS) Technology is making my romaine lettuce safe?
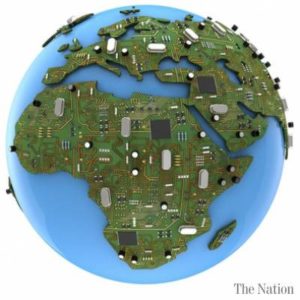
Image from: https://nation.com.pk/23-Aug-2016/the-need-for-gis
GIS refers to the combination of geographical data with attribute data (such as climate conditions, or other characteristics of a location). For produce production in particular, GIS has already been implemented in some cases to predict potential produce contamination. Satellite data and remote sensing techniques can give data on changes in land cover, which when combined with other data such as soil properties, properties, temperature, and proximity to urban development7, can be used to build predictive risk-assessment models. For instance, GIS-Risk is a program developed by the FDA and NASA to assess environmental risks for microbial contamination of crops prior to their harvest8. Using these tools, growers are able to predict when and in which part of the farms microbial contamination are more likely, so they can intervene early and minimize cross-contamination onto produce.
Image from: https://www.eatthelove.com/lemon-pudding-romaine-lettuce/
Researchers were able to find useful patterns based on these huge datasets, such as how after heavy rains, a produce-growing region in California saw increased cases of E. coli O157:H7 contamination. They were able to look at historical data of intense weather and flooding events, and connect that to the resulting rise of environmental pathogen levels7, which eventually led to cross-contamination of produce pre-harvest. This not only helps growers reduce pre-harvest food safety hazards before they are out on the market, but also gives them useful information on the transmission routes of foodborne pathogens so preventative measures can be put into place.
This is where big data analytics truly shines, since different types of data (attribute data, aerial imaging data and contamination prevalence) can be combined and combed through to not just predict the location of contamination, but to also find the main factors that exacerbate contamination of different pathogens. For instance, Salmonella detection might be more successful when using predictors such as drainage class, soil available water storage (AWS) and precipitation, whereas L. monocytogenes detection depended more heavily on temperature, soil AWS and landscape features such as nearby urban development9. This allows growers to focus on collecting certain data that are more relevant, as well as build better models for prediction.
Case 3: Chicago’s Sanitation Inspections
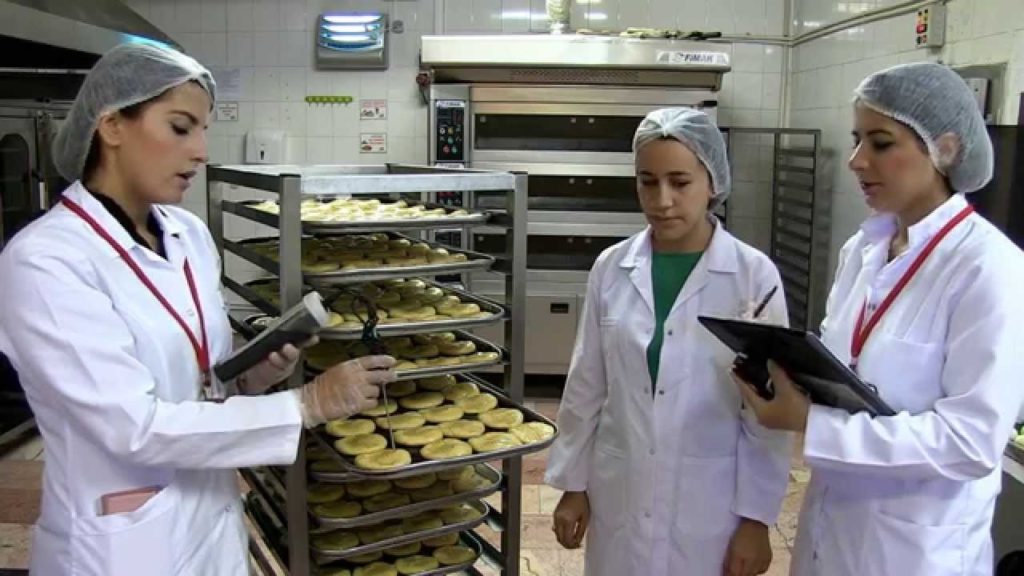
Image from: https://www.youtube.com/watch?v=R64cp6_NyQk
In the city of Chicago, there are only 32 inspectors responsible for the sanitary inspections of over 15,000 food establishments in the city of Chicago, which boils down roughly 470 establishments per inspector. Critical violations of the sanitation code can lead to the spread of foodborne illnesses, thus catching restaurants with violations early on is paramount.
The program analyzes 10 years of historical data using 13 main predictors (such as nearby garbage complaints) to identify the high-risk establishments, with the goal of diverting precious resources (inspectors in this case) to the riskier food establishments so any critical violations can be quickly identified and rectified before they make anyone sick.
Based on results from the analysis, a 2-month pilot program in which inspectors were more efficiently allocated was launched10. On average, establishments with violations were found 7.5 days earlier than when the inspectors operated as usual11. Want to know the best part? The analytical code used for forecasting food inspections is written on an open-source programming language and available for free on Github, allowing users to continually improve the algorithm.
Case 4: Whole Genome Sequencing
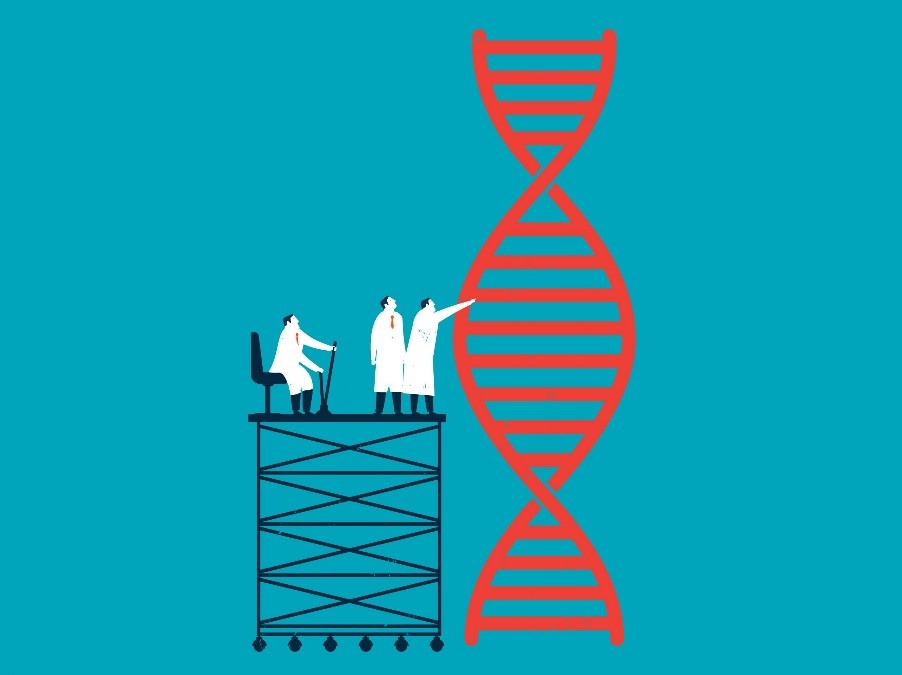
Image from: https://www.wired.com/story/you-can-get-your-whole-genome-sequenced-but-should-you/
The advent of affordable and rapid whole-genome sequencing is producing a wealth of high-resolution genomic data. At the most basic level, whole-genome sequencing can differentiate virtually any strain of pathogens, something that previous techniques such as pulsed-field gel electrophoresis (PFGE) was unable to do. At the higher level, genomic data is being generated in enough high-resolution to track and trace foodborne illnesses across different food sources, food-manufacturing facilities and clinical cases.
The FDA is also fronting an international effort called the GenomeTrakr network, where laboratories around the world are sequencing pathogens isolated from contaminated food, environmental sources and foodborne outbreaks12. This effort culminates in an international database where public health officials can quickly assess for information when needed. Hypothetically if a food outbreak occurs, the pathogen can be isolated from the offending food, its genome sequenced and then quickly compared to the database. Since the genomic data of a particular species or strain of foodborne pathogen is different from one geographic area to another, knowing the geographic area of the unknown pathogen can be instrumental in determining the root source of contamination.
Given our increasingly global food supply and the fact that food products are often multi-ingredient, this will be a robust tool for tracking food contamination quickly and removing any contaminated food products from the food supply.
What’s next?
Image from http://www.stopfoodborneillness.org/awareness/what-is-foodborne-illness/
Foodborne illnesses kill almost half a million people per year13, with many more hospitalized, and even many more who are affected but did not report their symptoms. Given recent developments in our ability to capture, store and process data, the food industry is uniquely positioned to take measures to reduce foodborne illnesses. The case studies here are isolated to give an example of what predictive analytics and big data can mean for food safety. It is not just about what particular technology, sensor, or algorithm that can work its magic, but it is also about the aggregation of large, seemingly unrelated datasets, can reveal patterns and help us innovatively improve food safety.
Facilitating the adoption of data-driven culture in food science and safety requires not just the support of academia, but also pitching in from the government and industry. There are many eager academic institutions and community programmers who are excited to help. Work that can be done today includes developing the big data infrastructure, training and awareness for future food professionals.
Want to learn more? Follow us on Instagram and Facebook for quick updates on seminars, events, and food science!


we can store the best data in the system and those data will safe which is really helpful for us. And In this post, you provide good information and it is really helpful for us. we used the best type of technology and it is really helpful for us. And if I have any error code 0x80071a90 then go to the support team to solve the problem.